NHL ASGToL Format & Standings
Not seeing the updated bracket? Refresh your browser.
Last update: 10 November 2010 | Next update: 18 November 2010
Standings
| Rk | Team | Wk1 | Wk2 | Wk3 | Pts. | |
|---|---|---|---|---|---|---|
 |
1 | 2012 Ottawa | 73 | 81 | 69 | 223 |
 |
2 | 2004 Minnesota | 73 | 72 | 62 | 207 |
 |
3 | 2001 Colorado | 63 | 72 | 38 | 173 |
 |
4 | 2009 Montreal | 75 | 49 | 61 | 185 |
 |
5 | 1991 Chicago | 64 | 51 | 31 | 146 |
 |
6 | 2007 Dallas | 36 | 51 | 39 | 126 |
 |
7 | 1998 Vancouver | 27 | 49 | 49 | 125 |
 |
8 | 1997 San Jose | 37 | 28 | 51 | 116 |
 |
9 | 1980 Generic | 27 | 28 | 55 | 110 |
 |
10 | 1993 Montreal | 25 | 19 | 45 | 89 |
| Rk | Team | Wk1 | Wk2 | Wk3 | Pts. | |
|---|---|---|---|---|---|---|
 |
1 | 2000 Toronto | 75 | 85 | 81 | 241 |
 |
2 | 2008 Atlanta | 70 | 50 | 66 | 186 |
 |
3 | 2002 Los Angeles | 59 | 46 | 64 | 169 |
 |
4 | 1994 New York City | 63 | 50 | 48 | 161 |
 |
5 | 1992 Philadelphia | 41 | 62 | 56 | 159 |
 |
6 | 1990 Pittsburgh | 58 | 48 | 36 | 142 |
 |
7 | 2011 Raleigh | 25 | 54 | 52 | 131 |
 |
8 | 1999 Tampa Bay | 37 | 52 | 34 | 123 |
 |
9 | 1996 Boston | 42 | 38 | 19 | 99 |
 |
10 | 2003 South Florida | 30 | 15 | 44 | 89 |
Final Standings
Tie-breakers: To break a tie in the standings, the edge will go to: 1. Head-to-head winner, 2. Best high score, 3. Best low score.
Notes: Standings updated every Monday after all polls close. Tables are sortable by header. Top 4 from each group advance to playoffs.


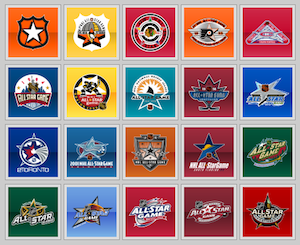
To keep the next mini-tournament at a reasonable size, we're sticking to All-Star Game logos that go back the past two decades, when the league really paid attention to branding each one individually. In addition, we'll include the generic logo found on every bit of All-Star marketing material through the 1980s. And of course, the tourney will feature the recently-released logos for the yet to be played 2011 and 2012 games.
This gives us a grand total of 20 logos, which have been divided into two groups which are random up to a point. Each group has an equal number of logos from the 80s/90s, 00s and 10s. Higher resolution versions of each logo will be available when voting begins. The voting format is outlined below.
Format
Eligible Logos 20; NHL All-Star Game logos used between 1990 and 2012, along with the generic 1980s mark, will give us an even number of logos for this tournament.
Preliminary Round Just as in previous mini-tournemnts, the preliminary round, in a round-robin format, will last three weeks with each logo facing three others from its own division. Opponents are randomly determined week by week. As with all tournaments, logos accumulate points in the standings based on percentage points won in the polls. (Example: A logo that earns 62% of the vote in a poll collects 62 points in the standings that week.)
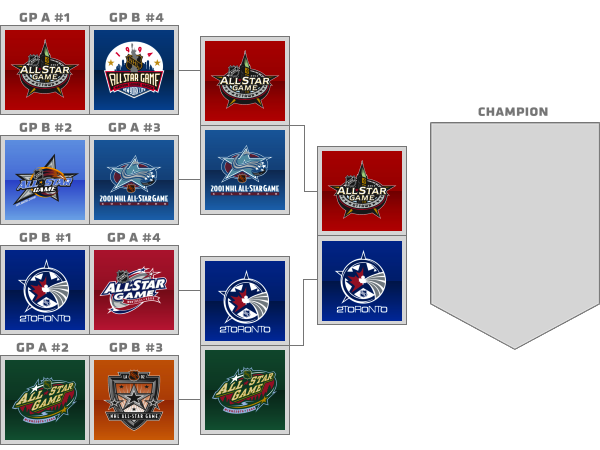
Quarterfinals As usual, the Top 4 logos from each group will advance to the first round of playoffs. Group A's #1 seed will play Group B's #4 seed, Group A #2 faces Group B #3 and so on. The logo with more votes in each poll wins and advances to the next round.
Semifinals The winners of the Quarterfinal polls advance to the Semifinals and face the opponent designated in the bracket. The logos with more votes in their respective polls win and advance.
Championship Final The winners of the Semifinal polls advance to the Championship Final. The logo with more votes at the end of the poll wins the tournament and universal bragging rights.