

Stat Junkie: Who's On Top?
/I love numbers.
As a sports fan, this is a very good thing that can be used to great advantage in a fantasy sports perspective. While most people love watching the game and getting into the game (don't get me wrong, I love that too), I'm always wondering what kinds of effects certain statistics have on a team's perception, and more importantly, how accurately do the numbers tell the whole story of a team?
It's why I love sports — the numbers are just a part of any given story.
So, I decided to grind out some calculations to determine what teams were considered the best in the IceHL's NHL portion of the season, not only to measure the teams against each other, but to answer one question: do the numbers support what is happening in the league?
While the AHL season was just as important, for the purposes of this exercise, we're sticking to one side of the league since points tracked are different for both. (But, if enough people are interested, we might do something like this for the AHL.)
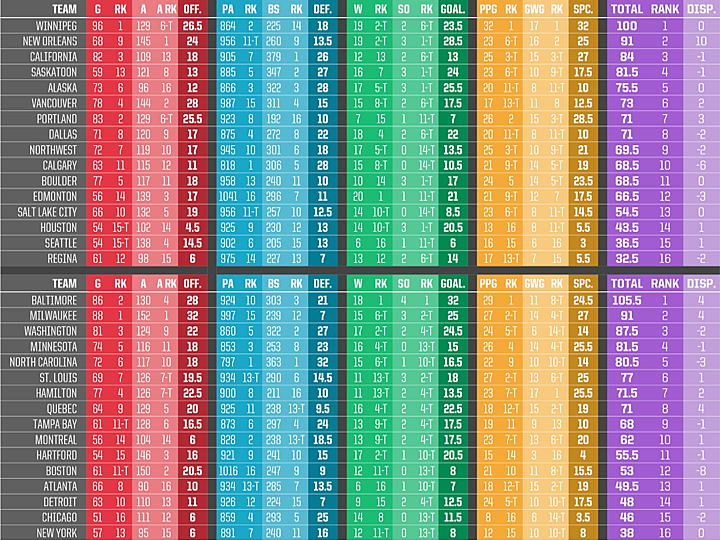
So, here's an explanation of how the stats were calculated. These were calculated using the statistics at the conclusion of Week 19 of the IceHL season.
-A statistic was selected and each team was ranked on a 1-16 scale.
-Points were assigned to these values, 16 points for 1st place, 15 for 2nd place, and so on until 1 point was awarded for 16th place.
-Any ties within a ranking were settled by taking the average point total of the positions taken up by the tie and dividing them evenly among the teams involved. (EXAMPLE-A three-way tie for 6th place would involve 3 teams, the next available position being 9th. Thus, we take points from 6th, 7th and 8th place (11, 10 and 9), add them up (30) and split them among the teams, so each team would get 10 points.)
-Each stat was half of one group. The overall total points of stats are the combined scores in both stats, making the max number of points a team could earn in a given group 32.
-The Overall end ranking is a cumulative score of the 4 groups, so the maximum number of points a team could have there is 128.
-Ties in the Overall end ranking were settled by who had higher ranks in any category, so if a team had two 1st place rankings, but the other has only one, the team with two wins the tie.
Our groups were as follows:
Offense: Calculated with Goals and Assists
Defense: Calculated with Points Allowed and Blocked Shots
Goaltending: Calculated with Wins and Shutouts
Special Teams/Opportunists: Calculated with Power Play Goals and Game-Winning Goals
Overall: Calculated with results from the above 4 categories
OFFENSE: On the spreadsheet, this category appears in RED.
Perhaps the most interesting stat of the bunch to work on, offense told us some very interesting tales about the IceHL.
-Of the top 8 in the league (again, NHL standings ONLY), two teams did not have ranks that corresponded to the top 8 in goals out in the West. Saskatoon ranks 3rd in the NHL, but 13th in goals. That disparity is among the biggest in terms of difference between goals scored and rank out West. Calgary ranks 4th in the NHL, but only 11th in goals. The two teams not in the picture? Boulder (11th in NHL, 5th in goals) and Portland. (10th in the NHL, 2nd in goals)
-In terms of the East, two teams in the top 8 didn't have goals to match--Boston and Tampa Bay, both of whom were interestingly tied for 11th. The two teams with top-8 goal scoring not in the top 8 are Hamilton (4th in goals, 9th in NHL) and Atlanta (8th in goals, 14th in NHL). Boston's 7-position difference between goals and NHL record is the highest disparity in the East.
-Assist-wise, teams that hovered near the bottom of the rankings tended to have higher assists, as 12th-ranked New Orleans had the most assists. 16th-place Seattle managed to come behind only New Orleans, Vancouver and Edmonton. Right behind Seattle? Salt Lake City. Only three of the top 8 teams had assists in correspondence with the top 8. Of the 5 that didn't (California, Alaska, Dallas, Northwest and Calgary), no team ranked higher than 10th in assists. Alaska's team had the lowest assists in the West.
-In the East, three teams within the top 8 didn't have top 8 assist stats. The top three teams of Washington, North Carolina and Minnesota were ranked 9th, 10th and 11th in assists. Inside the top 8 of assists but outside of the top 8 in the conference were Quebec, Hartford and Hamilton. Hamilton was tied for 7th with St. Louis.
-With the West, the winner was the Vancouver Lumberjacks, earning 28 of a possible 32 points. Vancouver came in 4th place in goals scored and 2nd place in assists.
-In the East, the undisputed best offense was Milwaukee, taking top honors in both goals and assists. The Lagers won both categories by 2 over the 2nd place teams.
IceHL West Offense:
Gold: Vancouver Lumberjacks, with 28 points
Silver: Winnipeg Winterhawks, with 26.5 points
Bronze: Portland Pioneers, with 25.5 points
IceHL East Offense:
Gold: Milwaukee Lagers, with 32 points
Silver: Baltimore Blue Crabs, with 28 points
Bronze: Hamilton Steelcats, with 22.5 points
DEFENSE: On the spreadsheet, this category appears in BLUE.
Defense proved to be another interesting race to track, with both conferences boasting two very different races.
-In the West, 6 of the top 8 teams based on NHL records were in the top 8 of points allowed, with Northwest and Vancouver being the exceptions. Seattle (16th) and Portland (10th) were the two teams in the top 8 of points allowed (4th and 6th-Tied, respectively) while being outside of the top 8 NHL teams.
-Eastern teams within the top 8 were split in half, as only 4 teams inside the top 8 were among the 8 best points allowed. The 4 teams that were outside of that? Baltimore, Milwaukee, St. Louis and Boston. Only Baltimore was ranked outside of the bottom 3 teams.
-7 of the top 8 teams in the West were ranked within the top 8 of blocked shots, with Winnipeg being the only exception, ranking in the bottom 3 of shots blocked. Edmonton (9th in the NHL) ranked 7th in blocked shots.
-Out East, 6 of the top 8 teams based on their NHL records were in the top 8 of blocked shots. Milwaukee and Boston were the two exceptions, placing 12th and 9th place, respectively. 13th-place Chicago placed 5th in terms of blocked shots, while 14th-place Atlanta ranked 7th.
-The top 4 teams in the West were separated by only two points, and there was a tie for first in the West with Calgary and Alaska, with 28 points. The gap between the top 4 teams in the West is smaller than the gap between 1st and 2nd in the East.
-The North Carolina Nighthawks unanimously won the rights to be called "Best Defense" after having both the lowest points allowed and most blocked shots. They scored 32 out of a possible 32 points.
IceHL West Defense:
Gold: TIE-Alaska Huskies and Calgary Cavalry, with 28 points
Silver: Saskatoon Sharpshooters, with 27 points
Bronze: California Wave, with 26 points
IceHL East Defense:
Gold: North Carolina Nighthawks, with 32 points
Silver: Washington Sentinels, with 27 points
Bronze: Chicago Hitmen, with 25 points
GOALTENDING: On the spreadsheet, this category appears in GREEN.
Of the stats tracked, goaltending was probably the most tiered in that there were tons of statistical ties in tracking wins and goaltending shutouts.
-In the West, the top team with goaltending wins was the 9th-ranked Edmonton Kodiaks, sporting 20 goaltending wins. No other team in the West or East has as many wins.
-East's top ranked goalie wins team was the Baltimore Blue Crabs, with 18. Baltimore's 18 would be good for 4th in the entire IceHL, as Edmonton (20), Winnipeg and New Orleans (19 each) have more.
-5 teams had three shutouts in the West: New Orleans, Saskatoon, Alaska, Boulder and Houston.
-Baltimore leads the East and the entire IceHL with 4 shutouts.
-The West's goaltending was won by New Orleans, with 28.5 points out of 32.
-Out East, the Baltimore Blue Crabs won the goaltending categories unanimously with 32 points out of 32.
IceHL West Goaltending:
Gold: New Orleans Gators, with 28.5 points
Silver: Alaska Huskies, with 25.5 points
Bronze: Winnipeg Winterhawks, with 23.5 points
IceHL East Goaltending:
Gold: Baltimore Blue Crabs, with 32 points
Silver: Milwaukee Lagers, with 25 points
Bronze: Washington Sentinels, with 24.5
OPPORTUNISTS: On the spreadsheet, this category appears in ORANGE.
With opportunists, I decided to track power play goals and game winning goals for this, making it a partial blend of skill-based stats and special teams. Lots of ties out here, too, but there was less tiering than in goaltending.
-Out West, 3 of the top 8 teams record-wise did not make an appearance in the top 8 of power play goals scored. Calgary, Alaska and Vancouver didn't make the cut with their power play goals, while New Orleans, Portland and Boulder did.
-3 of the top 8 teams out East failed to make the top 8 power play goals as well, those teams being North Carolina, Tampa Bay and Boston. Making the cut instead were Hamilton, Montreal and Detroit.
-With game-winning goals, half of the top 8 teams by NHL record were not in the top 8 of game-winners. Saskatoon, Alaska, Northwest and Dallas were not in the pack. Interestingly, all but Dallas are in the same division. These four were beaten out by New Orleans, Edmonton, Portland and Boulder.
-Meanwhile in the East, 3 teams in the top 8, including the top of Washington and North Carolina, were not among the top 8 in game-winning goals. (Tampa Bay being the 3rd) Shockingly, the three teams that replaced them were the 3 best teams in this statistic: Hamilton (1st with 17) and the duo of Atlanta and Quebec. (2nd-Tied with 15 each)
-Winning the opportunist award out West, the Winnipeg Winterhawks clinched it with a perfect 32 out of 32, leading in both categories. Their victory was by 3.5 points, a margin larger than the gap separating the top 4 teams out East. (just 2 points)
-In the East, the Milwaukee Lagers won the award with 27 out of 32 points. Minnesota and St. Louis tied with 25.5 points, and the North Carolina Nighthawks were just half a point behind.
IceHL West Opportunists:
Gold: Winnipeg Winterhawks, with 32 points
Silver: Portland Pioneers, with 28.5 points
Bronze: California Wave, with 27 points
IceHL East Opportunists:
Gold: Milwaukee Lagers, with 27 points
Silver: TIE-Minnesota Mammoths and St. Louis Archers, with 25.5 points
Bronze: North Carolina Nighthawks, with 25 points
OVERALL: On the spreadsheet, this category appears in PURPLE.
-In summation, the Winnipeg Winterhawks won as the best team out West, earning 100 points out of a possible 128. While their defense could be considered their weak point, the fact that Winnipeg appeared on the podium in the other 3 stat groups more than made up for their defensive deficiencies.
-Out east, the Baltimore Blue Crabs won top honors with 105.5 points. While only making the podium twice, the Blue Crabs were in the race in nearly every statistic, making this team dangerous.
-Perhaps the single most fascinating team to study was the team that takes 2nd best team out West: the New Orleans Gators, earning 91 points. A large gap in defense was their lowest category, but in every other one, the Gators were exceeding expectations. This is a team that on paper, is way outperforming its present 12th place standing.
-Getting silver out East was the Milwaukee Lagers, earning 91 points. Their two top finishes in Opportunist and in Offense, in addition to their 2nd place finish in Goaltending were enough to hide the team's largest deficiency: defense, where the team was tied for worst defense with Detroit, and with Regina out West for the worst defense in the IceHL.
-The California Wave takes the bronze medal for the West with 84 points. Unlike the teams ahead of the Wave in both conferences, California's biggest shortcomings came on Offense (where they were the middle of the pack) and goaltending (a bottom 5 squad). But their defense and opportunity-seizing team is enough to give them a spot on this podium.
-In 3rd for the East is the Washington Sentinels, earning 87.5 points. The Sentinels ranked somewhat low in Opportunist (bottom 5) but managed respectable finishes in all other stats, making the Sentinels a balanced and fierce threat.
IceHL West Overall:
Gold: Winnipeg Winterhawks, with 100 points
Silver: New Orleans Gators, with 91 points
Bronze: California Wave, with 84 points
IceHL East Overall:
Gold: Baltimore Blue Crabs, with 105.5 points
Silver: Milwaukee Lagers, with 91 points
Bronze: Washington Sentinels, with 87.5 points